CCD Spectrography

Optical
low resolution long slit spectrum of star 90 PSC
CCD spectrography
is a powerful tool for our understanding of the physical and chemical
composition of the universe.
At OAC we regularly use two spectrographs:
- IRF's stellar self guiding spectrometer SBIG SGS, a Czerny-Turner style spectrometer
- OAC's CCD nebular
spectrometer SBIG DSS-7
Moderately High dispersion CCD Spectrography
At
OAC we are going to realize a library of moderately high dispersion CCD
long slit stellar spectra, by means of the SGS spectrometer, at a
dispersion of about 1.07Angstrom/pixel.
These spectra were taken by
OAC's director M.M.M. Santangelo, sometimes with the help of his
co-workers; one of them is shown below as a frame.

Moderately high resolution long slit spectrum of star 2 Ori
Below we show some tracings of (moderately) high dispersion long-slit CCD spectra of various stars and nebulae recorded at OAC.
- Mintaka(O9 II + O9 V) in the blue region - Dec 28th, 2012, with the 30 cm Schmidt-Cassegrain
- Mintaka(O9 II + O9 V) in the blue region - Jan 26th, 2013 with the 30 cm Schmidt-Cassegrain
- Mintaka(O9 II + O9 V) in the red region, with the 30 cm Schmidt-Cassegrain
- P Cyg (B1 Ia peq) in the blue region, with the 60 cm Cassegrain
- P Cyg (B1 Ia peq) in the red region, with the 60 cm Cassegrain
- Atik (B1 Ib) in the blue region, with the 60 cm Cassegrain
- Spica (B1 III) in the blue region, with the 30 cm Schmidt-Cassegrain
- Algenib (B2 IV) in the blue region, with the 60 cm Cassegrain
- 7 Hya (B3 V) in the blue region, with the 60 cm Cassegrain
- Iota Herculis (B3 V) in the blue region, with the 30 cm Schmidt-Cassegrain
- 42 Peg (B8 V) in the blue region, with the 60 cm Cassegrain
- 42 Peg (B8 V) in the yellow-red region, with the 60 cm Cassegrain
- 73 Cet (B9 III) in the red region, with the 60 cm Cassegrain
- Vega (A0 Va) in the blue region, with the 60 cm Cassegrain
- 2 Ori (A1 Vn) in the blue region, with the 60 cm Cassegrain
- Menkalinan A2 IV + A2 IV-V) in the blue region, with the 30 cm Schmidt-Cassegrain
- Menkalinan A2 IV + A2 IV-V) in the blue-green region, with the 30 cm Schmidt-Cassegrain
- Menkalinan A2 IV + A2 IV-V) in the red region, with the 30 cm Schmidt-Cassegrain
- HD 192678 (A2p Cr) in the blue region, with the 60 cm Cassegrain
- 52 Her (A3 Vp Sr-Cr-Eu) in the blue region, with the 60 cm Cassegrain
- Rasalhague (A5 III) in the blue region, with the 60 cm Cassegrain
- 10 Aql (A7 Vp Sr-Eu) in the blue region, with the 60 cm Cassegrain
- Zeta Leo (F0 III) in the blue region, with the 30 cm Schmidt-Cassegrain
- Procyon F5 IV-V) in the blue region, with the 30 cm Schmidt-Cassegrain
- Procyon F5 IV-V) in the red region, with the 30 cm Schmidt-Cassegrain
- 1 Ori (F6 V) in the blue region, with the 60 cm Cassegrain
- Sadalsuud (G0 Ib) in the blue region, with the 60 cm Cassegrain
- Sadalmelik (G2 Ib) in the yellow-red region, with the 60 cm Cassegrain
- Sadalmelik (G2 Ib) in the Ca II triplet NIR region, with the 60 cm Cassegrain
- M42 bright nebula in the blue-green region, with the 60 cm Cassegrain
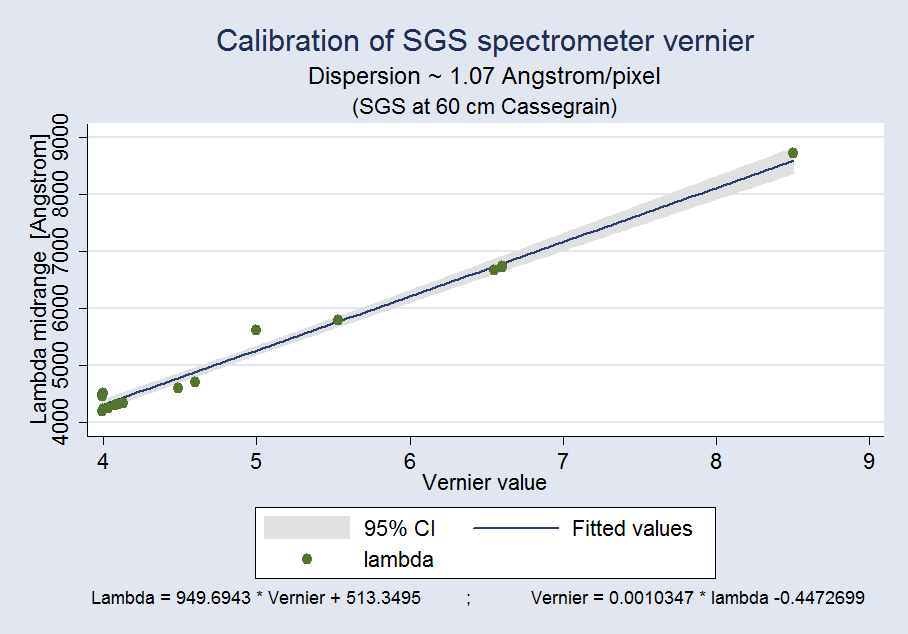
In
order to find the proper spectral range (namely the one which we are
interested in) with the SGS spectrometer we need to turn properly the
small control knob of the vernier which turns the diffraction grating.
But before doing so we need to make a calibration of the vernier
readings vs wavelength, In the following graph you can see such a
calibration for the 1.07 Angstrom/pixel dispersion.
Medium
dispersion CCD Spectrography
At OAC we are
going to realize a library of medium dispersion CCD long slit
stellar spectra, by means of the SGS spectrometer, at a dispersion
of about 4.3 Angstrom/pixel.
These spectra were taken by OAC's director M.M.M. Santangelo, sometimes with the help of his co-workers;
some of them (and cometary spectra too) are listed below both as tracings and as frames.
Medium
dispersion long-slit CCD spectrum of Betelgeuse
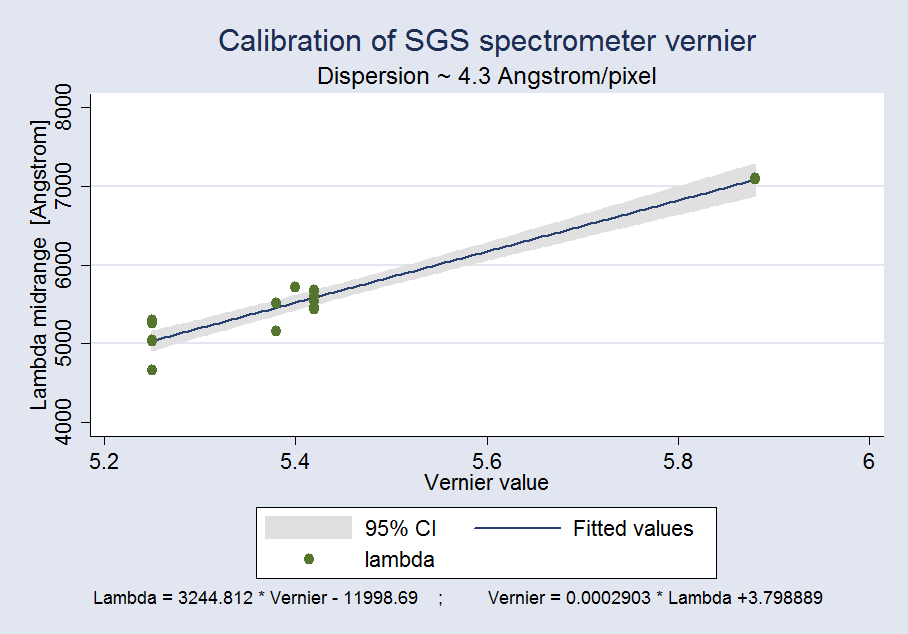
In
order to find the proper spectral range (namely the one which we are
interested in) with the SGS spectrometer we need to turn properly the
small control knob of the vernier which turns the diffraction grating.
But before doing so we need to make a calibration of the vernier
readings vs wavelength, In the following graph you can see such a
calibration for the 4.3 Angstrom/pixel dispersion.
Low dispersion CCD Spectrography
At OAC we have realized a library of low dispersion stellar spectra named OAC-LSS, by means of the DSS-7 spectrometer.
The dispersion of OAC-LSS is about 12 Angstrom/pixel.
All spectra of OAC-LSS were taken by OAC's director M.M.M. Santangelo with the help of Mrs. M. Pasquini.
In the following link you'll find OAC-LSS library:
Stellar classification by means of CCD spectrography
In the following link you'll find the list of spectral lines identified in the spectra belonging to OAC-LSS library:
Low dispersion Spectra List
Spectra of calibration lamps
Below we show some tracings of both moderately high dispersion and medium dispersion long slit CCD calibration lamp spectra:
Hydrogen (blue region)
Neon (red region)
Mercury
CCD Spectrography of variable stars
The
spectroscopy of variable stars can give us many information about the
nature of variable stars: especially if it is performed almost
simultaneously to the photoelectric photometry. At OAC we are
interested in CCD spectrography of variable stars too. In the following
lines there is a link to a sub-subpage about our CCD spectrography of
variable stars.
CCD spectrography of variable stars
Home |
|


